logo Virtual CommissioningTM (VCxTM) is an innovative energy efficiency program which provides utilities with a mass market small and medium business (SMB) solution by capitalizing on AMI investment. Want to learn more?
Feel Free To Contact Us
We’d be happy to hear from you and answer any of your questions about Power TakeOff services.

1-800-303-9890

support@powertakeoff.com

sales@powertakeoff.com

Top

Measurement & Verification (M&V) Modeling Approaches with Power TakeOff

Regression-Based M&V Built on Real Meter Data

Power TakeOff’s automated M&V software, Verify,  provides industry-leading Measurement & Verification (M&V) analyses grounded in IPMVP, DOE and BPA methodologies. At its core, Verify is rooted in linear regression based M&V, connecting energy consumption to independent variables that drive usage (most notably weather and operating schedules), ultimately creating a counterfactual.

Verify can model savings at the equipment level or whole facility level. With 15 years of experience analyzing performance across commercial and industrial customers, Power TakeOff helps utilities and program administrators implement M&V at scale through accurate analytics, transparent reporting, and fully remote program delivery.

What Is IPMVP Option C?

IPMVP Option C (International Performance Measurement and Verification Protocol) uses total facility-level energy consumption—typically utility meter data—to determine energy savings. This method is best suited when:

  • Efficiency actions affect multiple end uses

  • Submetering is unavailable or cost-prohibitive

  • The facility has sufficient historical data (typically ≥ 12 months)

  • You are installing measures that will reduce consumption across the entire building

Option C leverages actual utility meter data to quantify energy savings at the building level—making it ideal for complex facilities, large portfolios, and programs where operational or behavioral changes drive meaningful consumption reductions.

What Is IPMVP Option A/B?

IPMVP Options A and B (International Performance Measurement and Verification Protocol) use equipment-level consumption data—typically from spot measurements, BMS, or sub-metered data—to determine energy savings. Both options isolate and measure a specific piece of equipment or system (like lighting or a motor) rather than looking at the entire building’s utility bill.

Although both measure energy savings for individual pieces of equipment, they differ slightly.

Differences in Option A and Option B

Option A measures only the key parameters that affect energy use and estimates the variables (i.e., occupancy hours). This option is utilized when full-time metering is unnecessary and is most often used for lighting retrofits. Option A does not use a linear regression approach because the consumption is typically gathered from a spot measurement and the variables are stipulated.

Option B factors in independent variables that affect the equipment’s energy consumption in its savings calculation. Typically, weather, occupancy, or production schedules are measured along with the consumption data. Consumption is measured with sub-meters or BMS systems. Option B is used when operating conditions or loads fluctuate, so you typically see this option used for HVAC loads, lighting controls, and VFDs. 

Option B can utilize a linear regression M&V approach because the consumption data is continuously measured. This method is best suited when:

  • You want to isolate savings to a single piece of equipment
  • The facility has interval BMS or sub-metered data
  • Simple engineering estimates cannot capture interactive effects

A linear regression approach works best for heating and cooling loads (i.e., chillers, boilers, etc.), but can be used for any piece of equipment where temperature, occupancy, production, or building schedules affect energy consumption. 

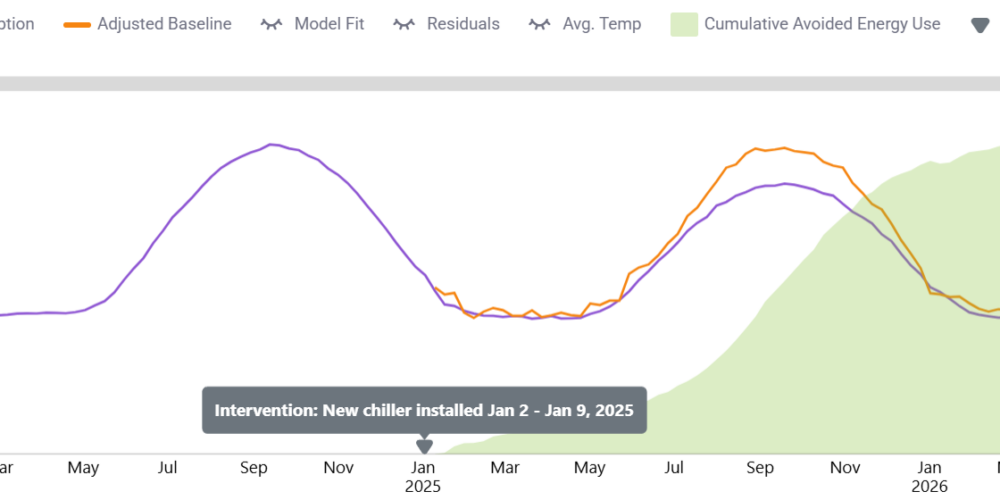
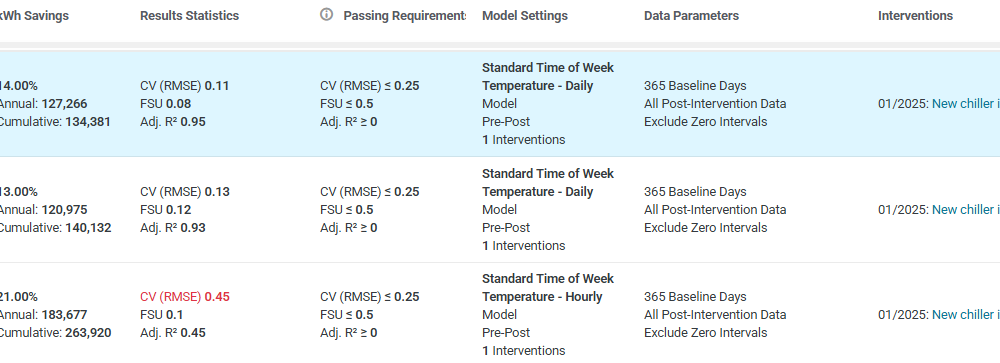
In the example below, we show how a chiller retrofit utilized a linear regression model to prove energy savings. A 12-month baseline period was used, as the building was equipped with a robust BMS system. The BMS system also logged Gallons Per Minute (GPM) and Tonnage per 15-minute interval. This chiller retrofit was commissioned in a commercial office building, so a daily time-of-week and temperature model was used, as the building’s occupancy was predictable and affected consumption. 

A normalized weather dataset was used to show annual savings for a typical year in this climate zone. You can see in the first model run, temperature and a time of week variable were the only independent variables used. Once GPM and tonnage were included as additional variables, the M&V model significantly improved. 

How Power TakeOff Executes Regression-Based M&V

1. Establishing a Baseline

Using advanced time-series regression models, Power TakeOff builds a robust pre-intervention baseline that reflects each project’s true consumption patterns. Modeling capabilities include:

  • Temperature-dependent load profiles

  • Production/occupancy normalization

  • Day-type and seasonal adjustments

  • Regression modeling following ASHRAE Guideline 14

The baseline serves as a statistically rigorous representation of how the facility would have used energy absent efficiency changes.

2. Post-Intervention Savings Analysis

After efficiency improvements occur—whether behavioral, operational, or low-cost tune-ups—Power TakeOff compares the post-period data to the modeled baseline to calculate savings. Our process includes:

  • Hourly, daily or monthly baseline comparisons

  • Persistence tracking over time

  • Intervention and event tagging

  • Savings confidence evaluation

The result is a clear, transparent calculation of energy savings.

3. Normalization for Independent Variables

To isolate the impact of efficiency actions, Power TakeOff calculates avoided energy or normalized savings, based on external and operational factors such as:

  • Weather fluctuations (CDD/HDD)

  • Occupancy and production level changes

  • Operational schedule or hours of use

  • Seasonal business cycles

  • Non-routine events (NREs)

We apply rigorous statistical adjustments and analyst validation to ensure savings represent true attributable impacts.

4. Transparent, Standards-Aligned Reporting

Power TakeOff’s reporting is built to be regulator-ready and utility-friendly. Reports include:

  • Baseline model specifications

  • Statistical goodness-of-fit indicators

  • Pre-/post-period energy data

  • Normalization calculations

  • Savings summaries at facility and portfolio levels

  • Documentation suitable for regulatory filings and settlements

Reports are formatted to align with industry standards and jurisdiction-specific M&V requirements.

Why You Should Choose Power TakeOff for your M&V Software Solution

✔ Enhanced Accuracy

Regression analysis is a natural fit for Power TakeOff’s meter-based expertise, enabling accurate savings determination without expensive site work.

✔ Scalable Across Thousands of Facilities

Automated analytics allow users to analyze and track savings across multiple portfolios.

✔ High Transparency and Regulatory Trust

Our M&V follows globally recognized protocols while offering clear documentation for reviewers, evaluators, and regulators.

✔ Ideal for Behavioral and Operational Programs

Verify captures savings from short-term and long-term operational improvements—making it perfect for Power TakeOff’s engagement programs.

Where Power TakeOff Applies Linear Regression

Power TakeOff uses linear regression M&V modeling to support a diverse set of utility energy efficiency initiatives:

  • Behavioral and operational optimization programs
  • Commercial and industrial engagement efforts
  • Small and medium business (SMB) energy efficiency programs
  • Custom project M&V and persistence verification
  • Portfolio-level pay-for-performance initiatives
  • Demand and load flexibility analysis
  • Monitoring-based commissioning utility programs 

Verify™ enables utilities to quantify real-world performance across broad customer groups, even when savings stem from complex or interactive changes.