Virtual CommissioningTM (VCxTM) is an innovative energy efficiency program which provides utilities
with a mass market small and medium business (SMB) solution by capitalizing on AMI investment. Want to learn more?
Feel Free To Contact Us
We’d be happy to hear from you and answer any of your questions about Power TakeOff services.
Missing data, whether in the baseline or reporting period, can cause headaches for M&V professionals. However, the IPMVP and recent software solutions provide support in these instances.
When baseline data is missing, you have a few options. Let’s say you are taking a whole-facility Option C approach, which calls for 12 months of utility bills, but the client only has 6 months of bills. If the 6-months of bills include most of the heating and cooling season variance, you can use this to conservatively estimate the missing months. You can also leverage building simulation software that provides consumption estimates based on the building’s equipment, size, use type, etc.
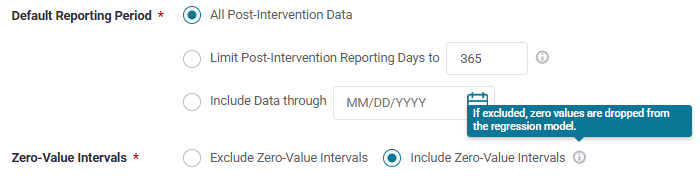
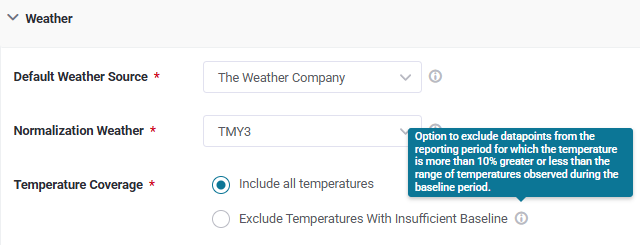
Once the reporting period is complete, machine learning in M&V software can automatically exclude insufficient data. This can include excluding temperatures from the reporting period that are greater than or less than 10% of the range of temperatures observed in the baseline. Machine learning can also automate the removal of zero-value intervals from the model. For example, let’s say the utility meter errored and reported 0 kWh consumption for the day. M&V 2.0 software automatically excludes this data and does not require manual intervention.
Ultimately, it is up to your judgment as an M&V professional to decide the best course of action when you are missing data in your M&V analysis. Review our previous article, ML and AI in M&V, to see how this process can be automated.
Integrating Smart Meter (AMI) Data into M&V Software
The adoption of smart meters has transitioned consumption data from 12 monthly bills to 8,760 hourly data points per year. This allows M&V professionals to better understand trends in energy usage, identify peak demand periods, and improve operational efficiency.
The first question many M&V professionals ask is “How do I get access to this data?”. For Option C Whole Facility approaches, one option is to utilize an API software, such as Arcadia or Utility API. If your customer uses utilities supported by these platforms, they can provide you with third-party access to this data. Another option is utilizing real-time equipment, such as a CT kit, with API capabilities. For Option B, BAS or submetered data can provide this level of detail. With either approach, this equipment can be installed in the Investment Grade Audit (IGA) phase to establish a credible baseline and reporting period. This data can be automatically imported via API integration.
The benefits of this data granularity are compounded when using an M&V software, as you no longer need to wait for the client/building owner to provide the most recent bills, removing large bottlenecks in M&V reconciliation. For the M&V professional, receiving 8,760 data points- but still using spreadsheets- can be time consuming to reconcile. M&V software is pivotal in analyzing this data, identifying non-routine events, and providing ongoing performance monitoring.
Combining Fault Detection and Diagnostics (FDD) with M&V
Explore how combining bottom-up equipment diagnostics (FDD) with top-down whole-building M&V creates a holistic energy management tool. Discuss how software can not only prove savings but also actively alert teams when energy waste occurs.